

Just as VB Help should be used frequently to check on the syntax of commands or to explore the many pieces of specimen code provided, the VB debugging tools should be used to trace the source of problems when programs do not behave as expected.
In writing VB software, three types of errors can occur:
Syntax errors (Compile errors)
Run-time errors
Logic errors
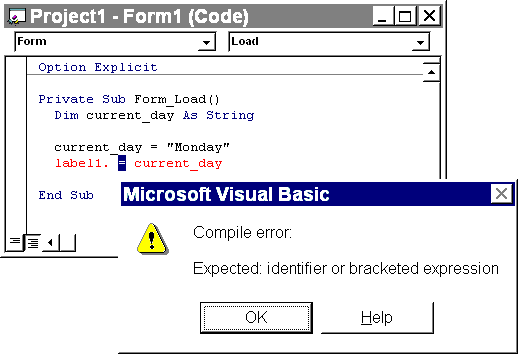
These are grammatical errors in the formulation of statements and are picked up by the interpreter while you are typing in the code (providing the syntax checking option - under environment options - is set to yes). In the example below the syntax of the assignment statement is incorrect - the property of Label1 is missing (the statement should be Label1.Caption = current_day). Visual Basic has signalled this error at design time by placing the cursor at the point of omission and displaying a pop up error message.

These are errors that cannot be detected until the program is running. The syntax of the statements is correct, but on execution they cause a situation to arise that results in a crash or an undefined value. Error handlers can be used to trap such errors and deal with them (these are beyond the scope of this course).
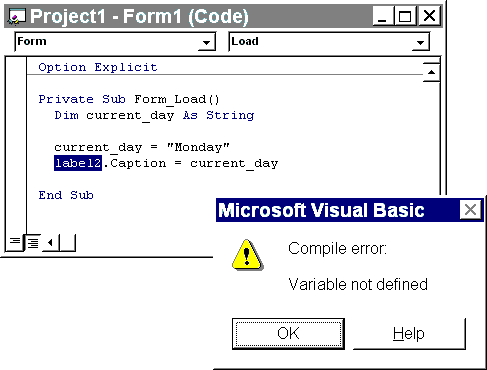
Examples of run-time errors are attempted division by zero or trying to access a non-existent object as in the example below (where Label2 has not been created).

These are errors that cause the program to behave incorrectly. They generally arise through failure on the part of the programmer to arrive at a correct algorithm for the task. Typical problems might be incorrect ordering of statements, failure to initialise or re-initialise a variable, assignment to an incorrect variable, use of ‘<’ instead of ‘<=’, use of ‘and’ instead of ‘or’, or omission of a crucial step in the processing. Logic errors may lurk in a program even when it appears to work - they may only surface under certain conditions. This is why careful testing is so important.
Debugging tools are designed to help with:
Stopping the execution of a program at specific points
Detecting run-time and logic errors
Understanding the behaviour of error-free code
Program errors can be very tricky to isolate. Sometimes they occur at the end of a long series of calculations or after many iterations of a loop. Programs execute very quickly and there is generally no opportunity to verify exactly what has been executed unless you build in diagnostic statements (such as print statements added to produce a trail, or to display intermediate calculations).
The VB environment includes tools to make debugging easier:
|
At design time you can change the interface or code but the effect on the executing program cannot be seen until run time. At run time you can observe the behaviour of the program, but not change it.
Break mode halts execution of the software and gives a snapshot of its state at a particular moment. Variable and property settings are preserved and may be inspected. In break mode you can:
Sometimes debugging requires analysis of what is happening to data. A problem may have been traced to the value of a variable or property but you need to know where the incorrect assignment occurred. The Debug window lets you display the value of variables either while a program is running or after it has been halted. The window consists of two panes:
Watch pane
Located directly beneath the Debug window title bar, this pane is visible only if you have selected a watch expression to be monitored during code execution. The displayed information includes the context of the watch expression, the expression itself and its value at the time of the transition to break mode. If the context of the expression is not in scope when going to break mode, the current value is not displayed.
Immediate pane
Located below the title bar, or below the Watch pane if it is displayed, the Immediate pane is where you enter code to execute it immediately. While working in the Immediate pane:

The Debug window can do different things depending on what mode Visual Basic is in:
When execution of a program has been temporarily halted and VB is in Break mode the Debug window can be used to execute single line commands entered by the user. For example, the user can click on the Debug window, type ‘Print Time$’, and hit
At run time, although you can’t enter statements into the Debug window, you can use it to display internal values without printing them to the actual forms. The Debug window is an object which has a single Print method. For example, the following line will send the name of the font used in ‘Label1’ to the debug window at run time:
Debug.Print Label1.FontName
Variables or constants can also be printed in the same way:
  Debug.Print intCurrentDay
  Debug.Print "Reached here in the code"
Note: The VB program which is still running may obscure the Debug window, thus it is advisable to move it so that the contents of the debug window can be seen.
Debugging is a process by which you find and resolve errors in your code. To debug code in Visual Basic, consider the ideas suggested below. These techniques can also be applied in different sequences.
Print the code, if you find it easier to read code on paper instead of online.
Run the application to find trouble spots:
Use debugging tools and techniques to isolate bugs and to monitor code flow:
Try out bug fixes and then make edits:
 Menu
Menu