Shear
and Bending Moment Diagrams using Relations between Shear
and
Bending Moment
|
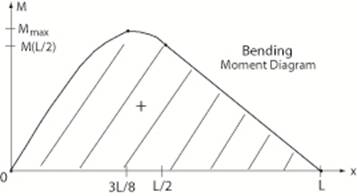
*Example: (continued) From the boundary conditions (supports at each
end), the bending moment is zero at x = 0 and at x = L.
The initial slope of the moment diagram is + 3L/8 at x = 0, drops to
zero at x = 3L/8, and remains at – L/8 from L/2
≤ x ≤ L. The maximum bending moment occurs when the slope dM/dx = 0 (@ x = 3L/8 .
Thus the maximum bending moment is just the area
of the triangle ABE, (1/2)(3wL/8)(3/8)L.
So Mmax = (9/128)wL2 . (result) Since the shear has constant value of − wL/8 from
x = L/2 to x = L, the bending moment is a straight line with slope – wL/8. The change
of the bending moment from x = L/2 to x = L is just the area under the shear diagram
from x = L/2 to x = L. This area is
just (– wL/8)(L/2) = – wL2/16.
Note: The moment diagram closes and ends up with a
value of zero bending moment at x = L which agrees with the boundary
condition at the end of the beam. This result provides a check on the moment diagram. The bending moment at mid span (L/2) is wL2/16 |
| Return to Notes on Solid Mechanics |
|---|
All rights reserved.