|
Strategy:
1. First check for symmetry. Note:
f(x,y,z) = f(˗x, ˗y, ˗z)
Result: The graph of f(x,y,z)
is symmetric about all three axes.
Next plot traces.
2. Traces for x = k = constant.
So y2+ 36z2
=
36 ˗ 36k2
which are ellipses for |k| < 1.
3. Traces for y = k = constant.
So 36x2 + 36z2 =
36 ˗ k2 which are circles for |k| < 1.
4. Traces for z = k = constant.
So 36x2 + y2 =
36 ˗ 36k2
which are ellipses for |k| < 1.
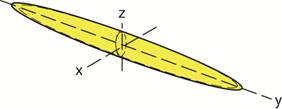
Result: The graph is an ellipsoid
centered at the origin with intercepts at
x = ±
1 ,
y = ± 6,
and z = ±
1
See the figure below.
|