Shear and
Bending Moment Diagrams using the Direct Method
|
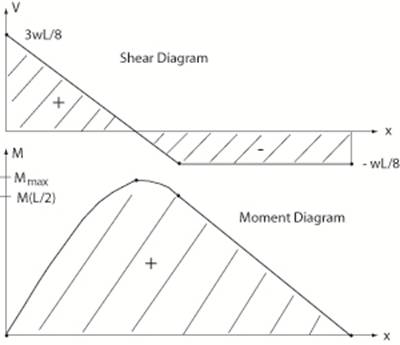
*Example: (continued) Strategy: Plot the expressions for shear,
V(x) and bending moment, M(x) developed in the sections of the beam from 0 ≤ x ≤
L/2 and from L/2 ≤ x ≤ L.
These plots are the shear diagram and the bending moment diagram. They show the distribution of shear force and bending moment throughout the
length of the beam. From
equilibrium for 0 ≤ x ≤
L/2: V(x) = 3wL/8 – wx and
M(x) = 3wLx/8 – wx2/2 From
equilibrium for L/2 ≤ x ≤
L: V(x) = – wL/8 and
M(x) = – wLx/8 + wL2/8 The maximum shear force from the top figure
is 3wL/8. The maximum
bending moment occurs when dM/dx = 0 (@ x = 3L/8) and from the
bottom figure is Mmax =
(9/128)wL2 The bending moment at midspan (L/2) is wL2/16 Click here to solve this example using relations
among shear and bending moment. |
| Return to Notes on Solid Mechanics |
|---|
All rights reserved.